Key Highlights
- Bitcoin started a fresh increase and traded to a new high above the $120,000 resistance.
- BTC/USD is following a bullish trend line with support at $119,500 on the 4-hour chart.
- Ethereum climbed higher above $3,000 resistance.
- XRP price rallied above the $2.80 level and tested the $3.00 zone.
Bitcoin Price Technical Analysis
Bitcoin price started a fresh increase above the $112,000 zone against the US Dollar. BTC was able to surpass the $115,000 and $116,500 resistance levels.
Looking at the 4-hour chart, the price settled above the $115,000 level, the 100 simple moving average (red, 4-hour), and the 200 simple moving average (green, 4-hour). The bulls even pumped the price above the $120,000 resistance.
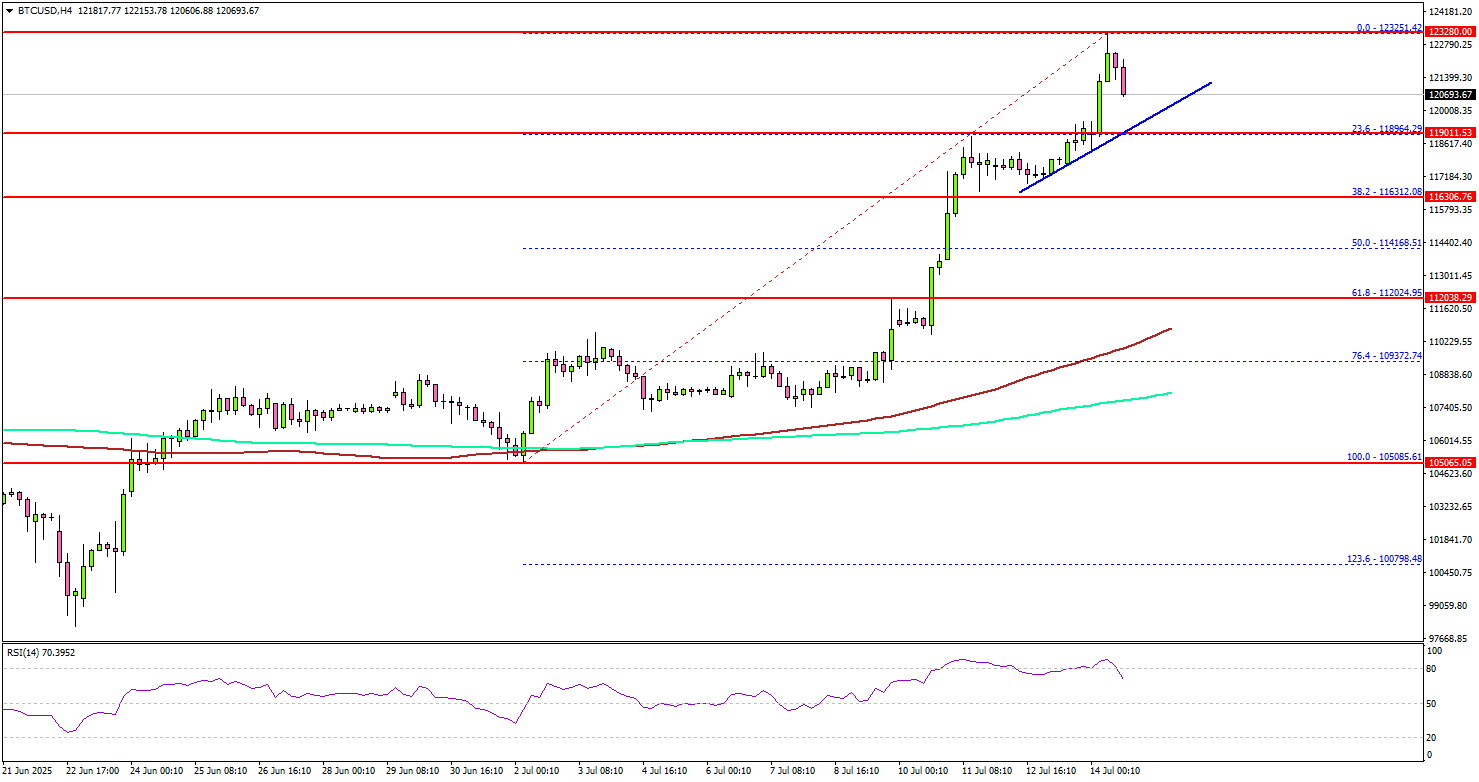
A new all-time high was formed near $123,200 and the price is now consolidating gains. If there is a pullback, Bitcoin might find support near the $119,500 level.
There is also a bullish trend line forming with support at $119,500 on the same chart. A downside break below $119,500 might send BTC toward the $117,500 support. Any more losses might send the price toward the $115,000 support zone.
On the upside, the price could face resistance near the $123,200 level. The next key resistance is $125,000. A successful close above $125,000 might start another steady increase.
In the stated case, the price may perhaps rise toward the $126,500 level. Any more gains might call for a test of $128,000.
Looking at Ethereum, the bulls seem to be in control, and they were able to push the price above the $3,000 resistance zone.
Today’s Economic Releases
- US Consumer Price Index for June 2025 (MoM) – Forecast +0.3%, versus +0.1% previous.
- US Consumer Price Index for June 2025 (YoY) – Forecast +2.7%, versus +2.4% previous.
- US Consumer Price Index Ex Food & Energy for June 2025 (YoY) – Forecast +3.0%, versus +2.8% previous.


 English (US) ·